Chernobyl and the Leiger
I'm going to Chernobyl, and I'm taking a GPS/Radiation logger that I built with me.
Early one Saturday morning in April 1986, a series of human errors led to the one of the worst and most memorable nuclear disasters in human history. Poor reactor design, inadequate safety procedures, and hubris caused an explosion to spread high levels of radiation thousands of square miles across the entire European continent. The disaster at Chernobyl is both fascinating and terrifying. Less than a week from today, I will be standing inside the Chernobyl Exclusion Zone with my wife Kim, David from IT, a backpack of photography gear, and a homemade GPS and radiation logger.
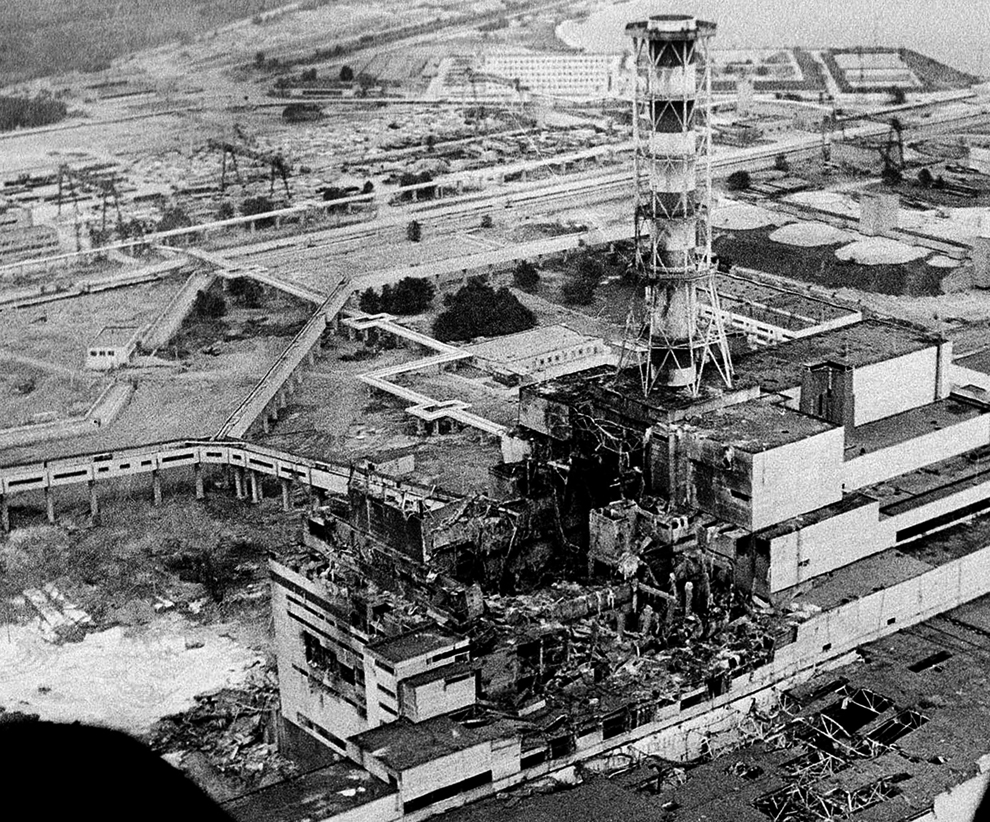
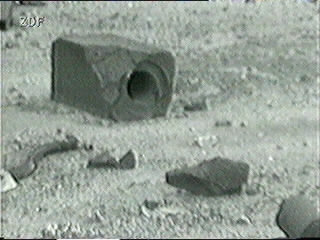
Whenever I told anyone about our trip, I got a lot of questions like, "Is it safe", "What is the radiation like", or even, "Is that really a great idea?". Honestly, I didn't have any good answers, and still don't. Although people are allowed into Chernobyl for tours, the area still contains significant deposits of radioactive material. Chunks of the radioactive core were dispersed throughout the area, much of which remains embedded in the ground to this day. Some areas will have normal background radiation levels, and others will have levels several thousand times higher.
To understand what all these readings meant, I first had to get a basic understanding of radiation levels. Here in Boulder, we see an average radiation level of 0.20 uSv/hour. Over the course of a year, we will see standard background radiation, radiation from the natural potassium in our bodies, and from other sources like x-rays. In a year, an average person is exposed to around 4mSv of radiation (or 4000 uSv). OK, now we're getting somewhere. So, what can I expect to see in Chernobyl? This chart gave me a little better idea what all the levels mean.
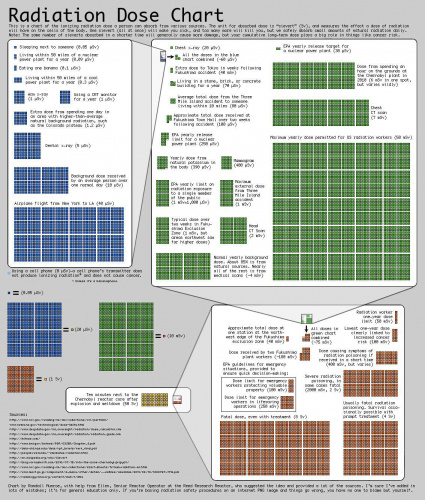
I've seen readings from sources online that range from 0.2 uSv/hr (the same as here in Boulder) to over 200 uSv/hour (and sometimes even higher!). Because of the random dispersal of radioactive material, the range of radioactivity is massive. This got me thinking, what if there was a radiation map that could show hot-spots? I decided I wanted to build my own Geiger counter, GPS logger, and dosimeter as a project. So, I built the Leiger.

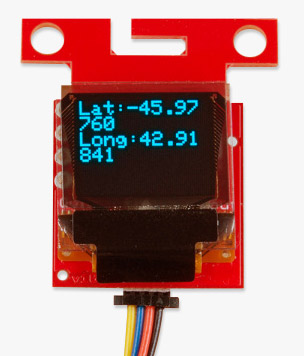
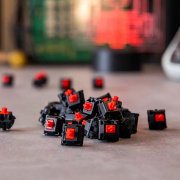
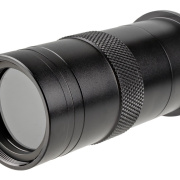
The Leiger combines an open-source Geiger counter (using a Russian SBM-20 tube), GPS module, OpenLog, and a PowerCell. When the unit is turned on, it will log the time, date, location, and all the readings from the Geiger tube. This should give me a radiation map of everywhere we travel inside the zone. I will have more details (including a detailed build tutorial, example code, and of course all the data) when I get back. For now, here's a quick video of what's inside, and how it works.
I'm still not entirely convinced this trip will be safe, or is even a good idea. When I get back and look at the data, I'm not even sure what it will tell me. In my lifetime, Chernobyl will most likely never be considered 'inhabitable' or have safe levels of radiation. But, it's something I feel compelled to experience.
[UPDATE: You can see Robert's Chernobyl wrap-up here!]
Ready to get hands-on with GPS?
We've got a page just for you! We'll walk you through the basics of how GPS works, the hardware needed, and project tutorials to get you started.


