SparkFun's Awesome Solar Array
A look into our awesome solar array and what it's doing for SparkFun.
As you might know, SparkFun is now in an awesome new building. We have posted some other blogs such as how to build a building, but what we have yet to talk about is our amazing solar array we have on our roof. We currently have 672 Sunpower 327 Watt high efficiency modules, which can produce a peak power rating of 219,744 Watts of direct current with a 97.5% efficiency for DC to AC transfer. That’s a lot of power that we harness right here on our roof!
Solar panels were not always part of the initial plan for this building. It was a cool idea, but it is a large initial investment and Nate (our CEO) thought it best to wait to install them until somewhere down the line. That seemed like a good plan until we were informed that solar panels are heavy, and if we did not design the roof for them it would be a lot of extra work and money when we did want to put them in. So Nate decided to design for the solar panels from the start, which included an extra $18,000 in structural steel for the roof. Since we had the roof for the solar panels ready to go we decided to have the solar array from the start!
After some research, and some very optimistic proposals from solar companies, we chose a company and installed the solar panels, but sadly that was not the end of the complications. The solar array was installed and ready to go long before the electricians were ready to wire them in, which means that they were just sitting there not being used for peak summer months. And even after they were wired into our system and the grid we still had to wait to use them until the monitoring meter was installed.
But they are on our roof and they are working as best they can (we are in the winter months so this is the lowest output for the year).
So I, like many others, was very curious about the way Xcel pays us for our solar power energy. I thought that they would only pay us for excess energy we put back into the grid, that made sense to me, we put energy into the grid we get paid for that energy. And they do pay us for that, at about $0.07 per KWh here in Colorado (that number changes based on the state that you are in/energy provider). Cool - that’s great. What I did not know is that Xcel also pays us for everything our solar array produces regardless of if we use it ourselves or it goes back into the grid. This is a REC (Renewable Energy Certificate) credit, and so they also pay us $0.07 per KWh for this. The reason being is that we just produced energy that they did not have to. THAT’S AWESOME! So now instead of paying about $0.10 per KWh to get energy from the grid, we can use ours and instead get paid $0.07 per KWh. That’s a $0.17 per KWh profit for all the energy that we create for ourselves. And if we did produce extra energy from our solar array, which we are not currently, we would be paid around $0.14 per KWh for it.
Another thing that was a little confusing is what Xcel was billing us for. It makes sense to me that we use some amount of kWh of energy and we get charged (about $0.10) for that. And it also made sense that we are saving money by using power that our PV system produces instead of getting that from the grid. But there were other things on our bills as well. Mainly a “billable demand," and after doing some research and talking with some people from Xcel, I found out that this demand is the peak amount of power that SparkFun uses during that billing period. The units on this are in kW and it is taken over a 15 min interval.
So this is Xcel’s way of billing us for power and not just energy, which is smart because our energy bill would be the same if we had one 100 W light bulb on for the whole month, or if we had 2,880 100 W light bulbs on for 15 mins during the month (both are 72 kWh of energy). But having one 100 W light bulb on only takes 100 W of power were as 2,880 would take 288,000 W even if it’s only for 15 mins.
Xcel charges us $4.84 for every kW of our demand and there are some other costs associated with our demand as well, like an $8.00 per kW of demand charge that changes in winter and summer as well as other charges that add up to about $3 per kW of demand. So it started to seem like the energy we used wasn’t costing us as much as this 15 min peak demand. And now the question was are our solar panels helping with our peak demand?
After speaking with some experts from Xcel, I found out that unless we were producing more energy than we use during peak demand (in terms of what they bill us for) doesn’t change.
This was sad news, since the bill on our demands ends up being very close to our bill for our energy usage, so lowering that even just by a little would have a large impact.
The only way to lower that demand is to lower our energy needs, so either use less energy all the time, or spread it out so that not all of our electricity use happens at the same time.
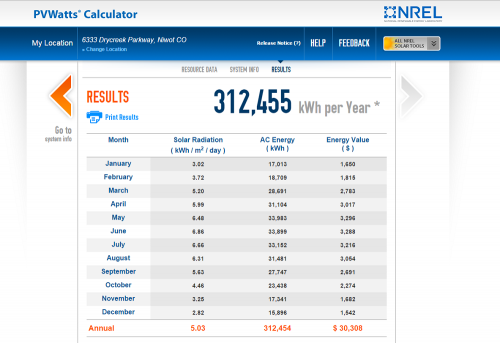
Colorado seems like one of the most ideal places to get solar panels since we get around 300 days of sunshine a year. Right now we are in the winter months so we are seeing the lowest output from our panels, but we can still look at the numbers and see how we are doing so far. In mid-September (right after we moved in) to mid-October we only used about 13.8 MW of energy from the grid, and we used 22.9 MW from our solar system for a total of about 36.8 MW. This means that we produced about 62.3 percent of our energy that month, which is pretty good for a fall month. But mid-November to mid-December we used 60.4 MW from the grid and 17.7 MW from our solar system for a total of 78.1 MW. This means we only produced about 22.7 percent of our energy, which is still nice. This information actually seems to match NREL’s website’s estimates for our type and number of solar panels in our city.
We are looking forward to spring and summer where we should see more output from our solar array and maybe even have a month where we only use our solar energy!
Our advice to people looking to put solar panels up? Make sure you have all the information. There are a lot of things that didn’t make sense and were unknowns, and it is always good to have as much information as you can before you start. Residential energy billing is different from commercial energy billing. Where SparkFun is being billed based on our energy and power, homes are often just billed on energy, but with varying costs for when you use is, like $0.10 per kWh on weekdays, and $0.14 per kWh on nights and weekends.
Do a cost analysis. These types of things are always better if you have the money up front, but if you are going to have to take out a loan to install them you need to weigh your expected monthly savings against interest costs. You have to really consider things like what is the payback period and the lifetime of the installation.
There are programs out there to help bring down the cost. Here in the United States lots of states give out incentives, rebates, and/or tax breaks as well as REC credits for just producing the energy, so take some time to do all the research and get help from organizations that are there to make sure you get all the money you can when you do stuff like this (for instance here in Boulder, CO there is EnergySmart.
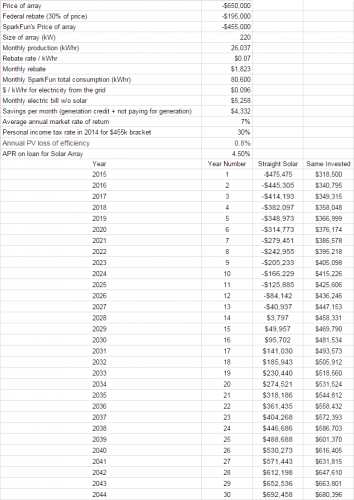
Here is a look at some estimations we made for our solar array:
The calculations above were based on our first bills/credits and NREL’s estimates, as well as information from our online monitoring system for our building. As you can see, for SparkFun, we had to take out a loan to be able to pay for the solar array. And as it is the payback period for our installation even, with the federal rebate is about 14 years, at which point we have paid back our loan with interest and are only making money by saving on energy expenses. The regular warranty for a photovoltaic solar panels is calculated to be about 25 years. The manufacturers come up with this number by estimating a loss of efficiency of 0.8% for every year (included in the above calculation).
At this rate of degradation, after 25 years, the panels will be down to operating at 80% of their original efficiency. Solar panels should meet a minimum 80% efficiency standard, in order to be effective. Therefore 25 years is the time predicted for these panels to degrade below an acceptable efficiency rate. Though many times PV panels can remain efficient up to 40 years, this is the manufacturing estimation, and therefore the estimation we used. As a price comparison, we also looked at if we just had taken the initial money and paid taxes on it and invested it how much would we have 30 years down the road. As you can see, the savings accumulated from the solar panels would just barely be better than the investment after 30 years, and this is taking into consideration that our PV systems efficiency has fallen to 76.8%. For now, even with federal rebates, the solar array isn’t efficient enough to make significantly more money than an investment in a timely manner. One thing that would have helped our payback period, and overall savings, would have been having the money for the solar array up front. It would have only taken us about 10 years to pay off the initial cost. So if money is the only reason you would like to install solar panels, you may want to wait until the technology advances, and the efficiencies increase. Otherwise if you just want to help out the planet a little, go for it!
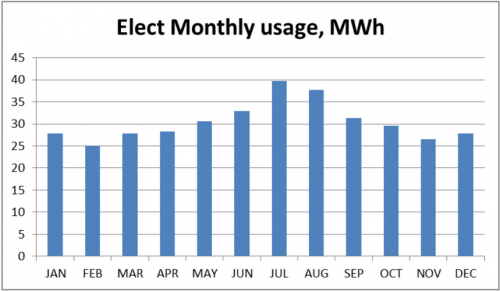
And on the note of estimated values, now that we have been in our building for a few months we can compare our models and energy estimations drawn up for the new building and compare these numbers to our actual energy use and see how things are matching up.
Figure 1:
If this were actually the case, our solar array is estimated to produce 312,454 KWh of energy a year (from NREL’s calculations), which means that SparkFun could produce 85.6% of our annual usage. But although our credit bills seem to be matching NREL’s solar array estimations pretty well, our energy usage and demand are much higher than was modeled or estimated.
From Figure 1 estimating our energy usage we should have expected to use a total of a little more than 30 MWh in September, a little less than 30 MWh in October, around 26 MWh in November and about 28 MWh in December. What we actually ended up using was 36.8MW from September to October, around 78 MWh from October to November, and 78 MWh from November to December. That a lot more than expected.
It looks like we are using about 2.5 times more energy than expected, and maybe it’s only for the winter months, but if this trend continues, our solar array may only be able to produce 34.2% of our annual usage. So estimations and models are nice, and sometimes the work out great, but sometimes the are not a good basis of what is to come.
Another interesting thing that came from our solar installation was our huge wires that we had to use to ground our solar array.
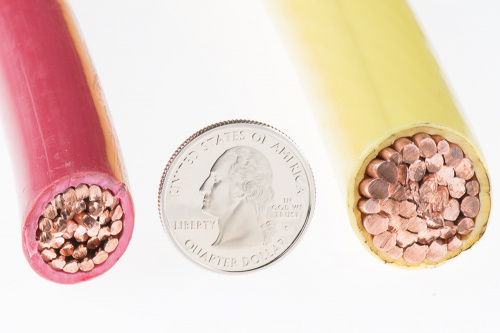
Here I am holding a red 4/0 gauge wire and a yellow 500 MCM gauge wire. Most sizing charts that I found only go up to about 4/0, so this yellow 500 MCM gauge wire is rather large and very heavy.
For reference, the standard 22 gauge wire that we sell is 0.025 inches (0.635 mm) in diameter. The 4/0 gauge wire is about 0.56 inches (14.37 mm) in copper diameter and weighs about 0.72 lbs (327 g) for the foot of length that I am holding. The 500 MCM wire is 0.76 inches (19.45 mm) in copper diameter and the foot and a half that I am holding weighs 2.42 lbs (1100 g)! It’s quite a lot of copper.
