Plotting Live Sensor Data with Python
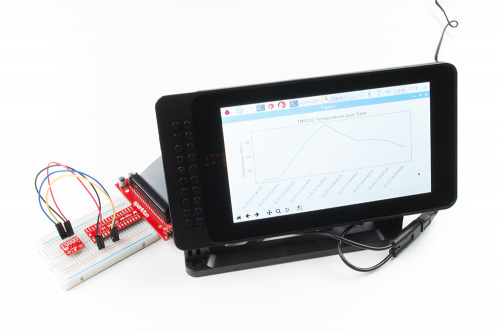
Whether you are teaching a class or want to create a dashboard to plot sensor data, the matplotlib Python package has you covered! We introduce a new guide that walks you through the basics of using matplotlib.
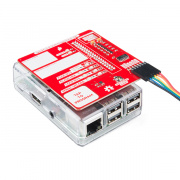
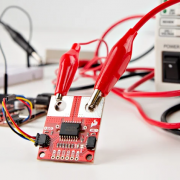
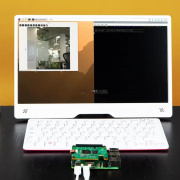
The Raspberry Pi (along with many other single board computers) offers the ability to directly connect to low-level hardware through its GPIO header. With this, we can communicate with sensors, take measurements and even use languages like Python to dynamically create graphs for us!
The ability to programmatically create graphs can be extremely useful if you want to set up some kind of monitoring system or dashboard to, say, keep an eye on your room's temperature. This could also be useful in classrooms to give students immediate feedback for sensor data, as well as create professional plots for reports.
Matplotlib is a plotting package for Python that works very similarly to the plotting functions found in MATLAB. If you're looking to find out more about matplotlib, check out our newest Python tutorial:
Graph Sensor Data with Python and Matplotlib
If you were going to make an interactive dashboard that shows live graphs, what kind of data would you want to show? I may or may not be looking for ideas for my next tutorial...

