Enginursday: The RedBot/MathWorks Collaboration
How to interface the RedBot with MatLab and SimuLink
As Jim mentioned on the last Enginursday, visually programming is a great way to get started with Arduino and other platforms, especially if you are relatively new to coding.
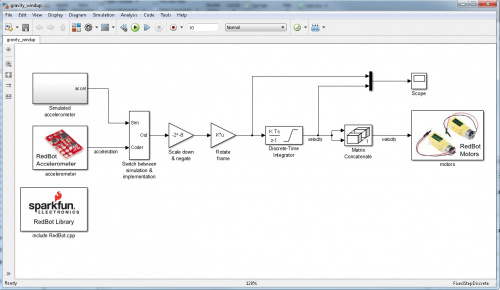
We have been working with the awesome folks over at MathWorks on implementing visual programming for the RedBot, to compliment the libraries they have already created for programming Arduino boards, Raspberry Pi boards, and others. They’ve created a library for running the RedBot in Simulink, a graphical block diagram environment built on top of MATLAB. For those of you unfamiliar with MATLAB, it is a numerical computing environment that is commonly used for processing large arrays of information. It's commonly used in industry and academic settings.
Now you may be wondering why we are so excited about this. The really great thing about MATLAB is its ability to process large arrays of data quickly and efficiently. Simulink also is a great tool as it allows you to test out code and run simulations of your system to check for errors before uploading it to your hardware. What does that mean in terms of project applications? You can quickly write up a demo sketch for your system without spending your time fighting syntax errors (raise your hand if you constantly forget the final '}' or those ever elusive line-ending ';' in your sketches like I do). This MATLAB/Simulink combo will also allow you to process large volumes of sensor data coming in from your robot army, automated kegerator, or self-driving blowtorch and manipulate the data and graph it easily. For example, if you needed to do some sound processing on your board, running Fast Fourier Transforms on an Arduino can eat up onboard memory and slow down your processor (not to mention it's yet another library to include in your code). Offloading this data processing to MATLAB gives you more options for playing with the data and allows you to immediately output some awesome graphs. Check out the cool Fourier transform of our flame, using the basic code of
You could even make a 3D graph showing the path your robot took based off of the encoder and accelerometer data. Check out the demo video for a quick overview of how quick and easy the interface is for programming your RedBot. You can also access a tutorial on Simulink and Arduino here, and the download for the library is available here.
ReplaceMeOpen
ReplaceMeClose
Hopefully this will become yet another useful tool for working with the RedBot. We're hoping that the library can continue to be expanded and will become a great resource for any one working on building their own robot army.
