Drifting Downhill with the SparkFun OpenLog Artemis
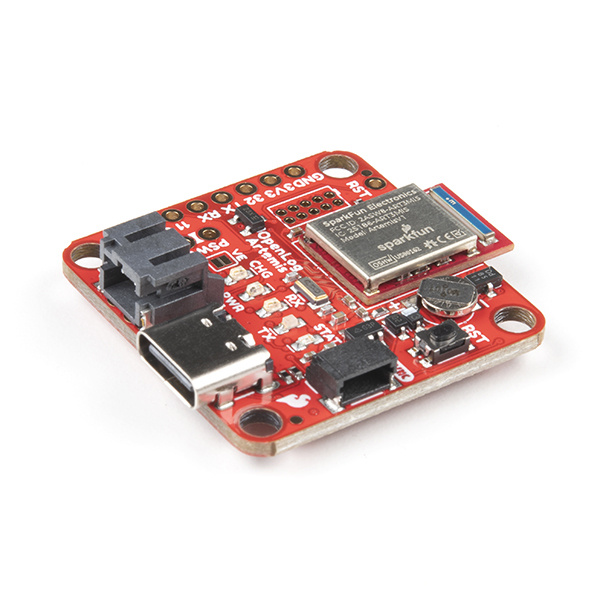
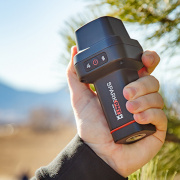
We tested out the new SparkFun OpenLog Artemis by taking it down one of Boulder's many hills of a driftable trike!
There are an infinite number of questions to be asked about the world around us. Why is my mail so banged up when it's delivered? Where did the banging around occur, and how large was the force? What is the ambient light when lightning bugs decide to come out and flicker? How do wind and/or speed determine when a moving vehicle will tip on a banked corner? How much does doing 360s on a drift trike slow you down on your ride, and what is the optimal speed at which to enter a 360?
We decided to tackle that last question, and using the new SparkFun OpenLog Artemis (“OLA”), gather data quickly about how the change in acceleration affects Cassy’s drift triking. The OLA was the ideal module to use for this project because it was so simple to configure and ultimately read data from.
All we did was load in a blank FAT32 micro SD card, hook it up to a power source, ensure the IMU was enabled, and send it speeding down a hill with Cassy. The data is written to a CSV file on the SD card as well as formatted correctly with column headers, so you won’t have to do anything to read the data… not even write one line of code!
If you do want to dive into the analytics of the data, the fact that it is already organized in a CSV makes it easy to play around with in any code editor/language. We specifically used Jupyter Notebook and Python and its associative libraries to visualize how speed changes when doing 360s on a trike.
The SparkFun OpenLog Artemis is the ultimate plug and play partner; it enables you to be an everyday scientist and ask questions about the world around you, and allows you to have fast feedback through its datalogging and sensing capabilities.
What questions will you start answering with it in your pocket? Let us know, and be sure to check out the project video below, as well as Rob's product video that goes over all the specs. Happy drifting and hacking!
