Cosm.com aka Pachube
Connect your Arduino Ethernet to the Pachube API to display and log data on the web.
ATTENTION: Due to a complaint about a trademark infringement, we were asked to change all instances of Cosm to Pachube. Cosm and Cosm.com are separate entities, one is a US trademark and one is a domain name. While we don't want to confuse you all, which I am sure we have already, we want everyone to be happy. I'm not sure it is fair to Cosm.com that we use Pachube, but at the same time, we don't want to resolve this through litigation. Basically, we can't use the word 'Cosm' even-though, we are referencing Cosm.com. Clear as mud?
About a month ago, I was moving my Geiger Counter feed over to the new Arduino Ethernet board. I previously had this setup connected to a computer running Processing, and sending data like CPM and uSv/hour to a free datalogging website called Pachube, for well over a year. The data I was feeding from the Geiger Counter was graphically displayed on a dedicated URL or embedded into a website elsewhere.
Here is the live Geiger Counter feed embedded into this post using Pachube's 'Graph Builder' function.
Displaying CPM for the last few months, updated every minute.
Here is how I got the feed above to work:
Sign-up with Pachube. It's free, but you have to register.
Now start a new feed, there should be a button on your console screen:

The current beta release of Pachube will now give you options to select things, like Arduino, Twitter, etc.
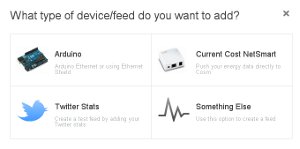
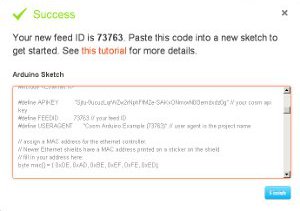
Select Arduino, create a name and tags for your project, then looky here!
They give you a nice Arduino .ino file pre-loaded with all of the relevant info, like your feed ID and API keys. You basically get your own graphical datalogging webpage with a nice shinny pair of keys pre-loaded for your Arduino.
The only things you need to change are these two line of code:
    // assign a MAC address for the ethernet controller.
// Newer Ethernet shields have a MAC address printed on a sticker on the shield
// fill in your address here:
byte mac[] = { 0x90, 0xA2, 0xDA, 0x0D, 0x74, 0x06};

// fill in an available IP address on your network here,
// for manual configuration:
IPAddress ip(192,168,20,254);
The MAC address should be on your Ardiuno Ethernet board and you also need to find an available IP on your network. To find an available IP (in Windows), open a command prompt and type 'ipconfig'. You should see the IP address of the computer you are using. I choose that number, but replaced the last digits with '254'. Then type 'ping your_new_ip_address' (e.g. 'ping 192.168.20.254') and if you don't get any response from the ping test, then the IP address should be open to use.
The example sketch Pachube gives you is for an analog sensor, but it isn't difficult to integrate the code into your own datastream, by inserting your own byte of data into the 'thisData' variable in this line of code (from the example .ino file).
        // here's the actual content of the PUT request:
    client.print("sensor1,");
    client.println(thisData);
You can also tag different datastreams in your code (sensor1, sensor2, etc) to display different types of data.
The web interface to build your graph is very easy. You can change things like pixel size, labels, units, etc.
If you want to see the Arduino code for my Geiger Counter feed it can be found here. I hope you all can start some feeds of your own and share them with the world! Have fun!

